Best Data Analytics Training Institute With Placements In Coimbatore
Data Analytics Course in Coimbatore
Data analytics helps businesses understand performance, identify trends and make informed decisions using data. Organisations use reports, dashboards and business intelligence tools to analyse sales, customers, operations and financial performance.
Our Data Analytics Course in Coimbatore introduces learners to Microsoft Power BI, data preparation, data transformation, data modelling, DAX, interactive reports and dashboard development. The syllabus follows a structured learning path from Power BI Desktop fundamentals to Power BI Service and data connectivity.
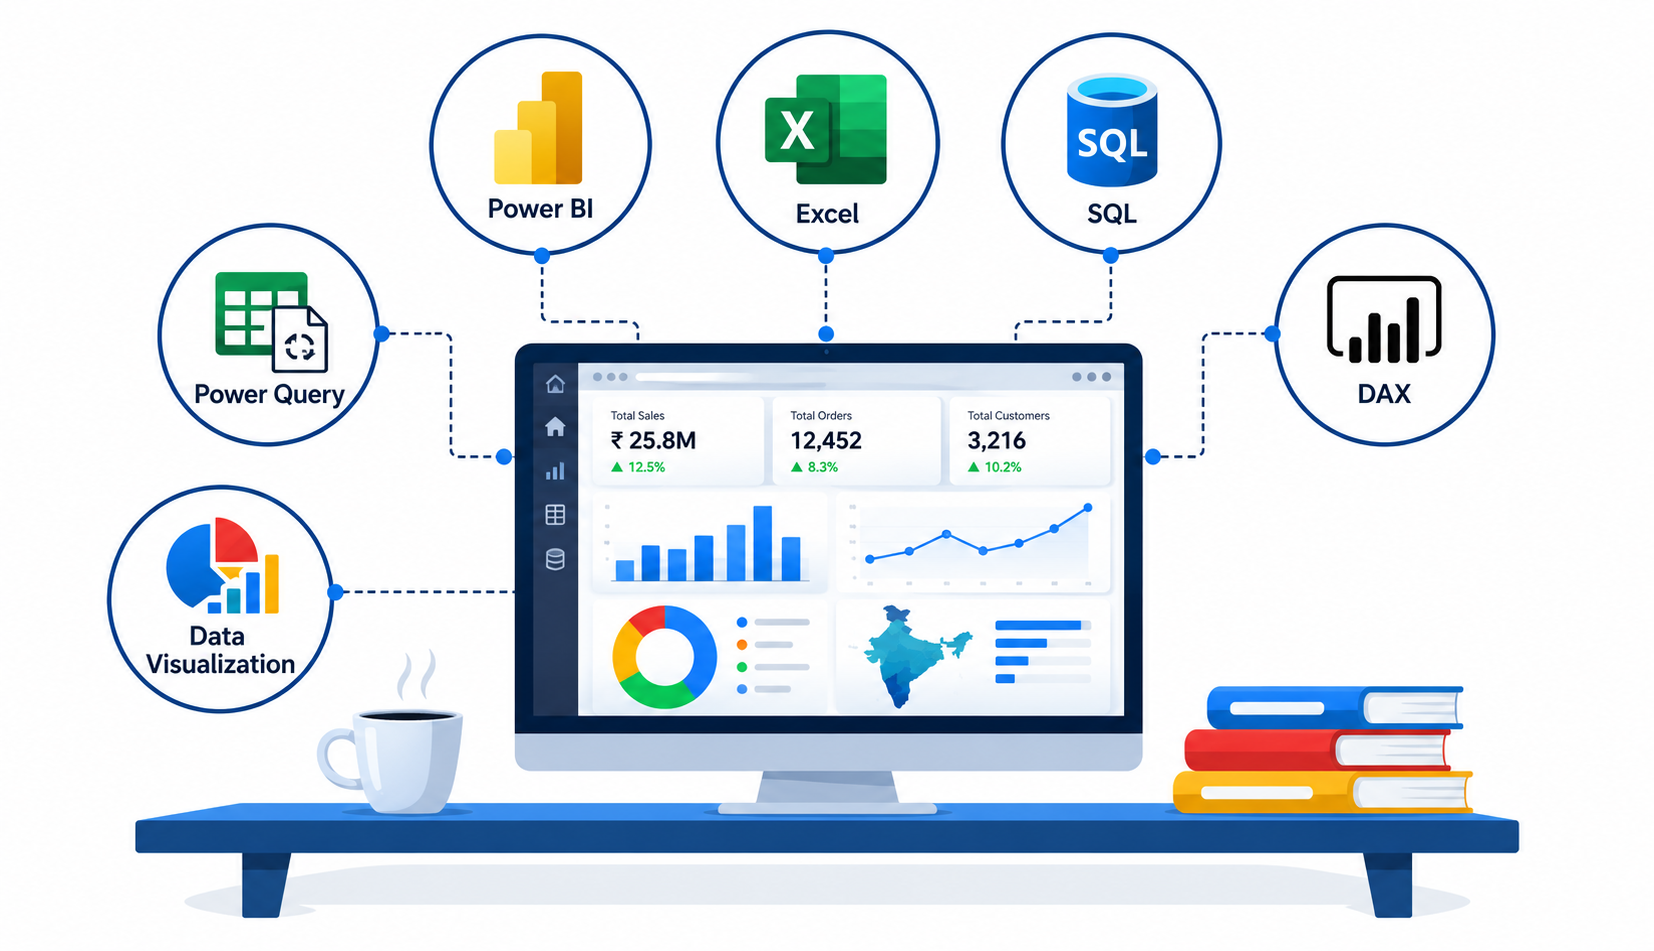
Through guided exercises and practice datasets, learners can understand how to transform raw data, establish relationships, create calculations and communicate findings through visual reports. The training syllabus also covers working with Excel, SQL databases and supported data sources.
Benefits of Learning Data Analytics
-
Power BI Fundamentals: Understand Power BI Desktop, its interface, installation, settings and available data connectors.
-
Data Transformation: Learn how to clean, filter, combine and reshape datasets using the Power Query Editor and M queries.
-
Data Modelling and DAX: Explore relationships, fact and dimension tables, calculated columns, measures, filter context and common DAX functions.
-
Interactive Dashboards: Learn to create charts, tables, maps, slicers, KPI cards, bookmarks and drillthrough reports.
-
Power BI Service: Understand dashboard sharing, publishing, refresh settings, notifications and row-level security.
-
Business Intelligence Skills: Build a foundation for analysing business performance and presenting findings through data-driven reports.
Who Can Join the Data Analytics Course?
This course can be explored by college students, fresh graduates, IT professionals, commerce graduates, management graduates and working professionals who want to develop data analysis and reporting skills. Contact our team to confirm the appropriate starting level for your background.
Career Opportunities in Data Analytics
Depending on your existing qualifications, practical knowledge and project experience, relevant career paths may include Data Analyst, Power BI Developer, Reporting Analyst and Business Intelligence Analyst.
DATA ANALYTICS COURSE SYLLABUS
Microsoft Power BI Course Syllabus
Explore the complete Power BI syllabus, covering Desktop fundamentals, data transformations, data modelling, DAX, report visualization, Power BI Service, Excel and direct connectivity.
-
Overview of Power BI
-
Installation
-
Settings
-
Types of Data Connectors
-
The Query Editor
-
Loading Data
-
Sorting a Column or Data
-
Date Filter
-
Text Filter
-
Date Transformation Columns
-
Remove Top Rows and Promote Headers
-
Keep Errors and Remove Errors
-
Replace Values and Errors
-
Add Index Number
-
Text to Column
-
Remove Excess Space
-
Time Transformation
-
Fill Down and Fill Up
-
Change Text to Upper, Lower and Proper Case
-
Creating Custom Columns
-
Using IF Statement
-
Try Otherwise Statement
-
Rename Steps and Describe the Query
-
Introduction to M Queries and Variables
-
Working with Table Functions
-
Extract Columns from Tables
-
Extract Rows from Table
-
Extract a Single Value from Tables
-
Group By Feature
-
Adding Conditional Formulas
-
Table Expansions
-
Adding Rank to Customise Table
-
Appending Query
-
Merge Query – All Joins
-
Combine All Worksheets in a Workbook
-
Combine All Workbooks from Folder
-
Data Source Settings
-
Query Refresh Settings
-
Pivot and Unpivot
-
User Function
-
Adding Parameter
-
Introduction to Data Modelling
-
Data Normalization
-
Fact Tables vs Dimension Tables
-
Managing Data Relationships
-
Relationships vs Merged Tables
-
Snowflake vs Star Schemas
-
Active vs Inactive Relationships
-
Understanding Filter Flow
-
Two-way Filters
-
Hiding Fields and Tables
-
Creating Calculated Columns
-
Creating Calculated Measures
-
Implicit vs Explicit Measures
-
Filter Context
-
DAX Syntax and Operators
-
Basic Date and Time Functions
-
Logical Functions
-
Text Functions
-
Joining Data with RELATED
-
CALCULATE and ALL Functions
-
CALCULATE and FILTER Functions
-
Creating and Managing Hierarchies
-
Using Calculated Tables
-
Time Intelligence
-
Manually Typing in a Data Table
-
Include and Exclude
-
Introduction to Report View
-
Adding Simple Objects
-
Inserting Basic Charts and Visuals
-
Hierarchical Axis and Concatenating
-
Analytics Pane
-
Formatting Options
-
Focus Mode and See Data
-
Map and Filled Map
-
ESRI Map
-
Waterfall Chart
-
Report Filtering Options
-
Table and Matrix Visuals
-
Date Slicers
-
Cards and KPIs
-
Text Cards
-
Treemaps
-
Line and Area Charts
-
Trend Lines and Forecasts
-
Gauge Charts
-
Editing Report Interactions
-
Adding Drillthrough Filters
-
Adding Report Bookmarks
-
What-if Parameters
-
Managing and Viewing Roles
-
Overview of Dashboards and Power BI Service
-
Uploading to Power BI Service
-
Quick Insights
-
Configuring a Dashboard
-
Adding Textbox and Image Widgets
-
Featured and Favorite Dashboard
-
Filtering Dashboard
-
Dashboard Settings
-
Natural Language Queries
-
Featured Questions
-
Sharing a Dashboard
-
In-Focus Mode
-
Pinning a Live Page
-
Custom URL and Title
-
TV Mode and Collapse Navigation
-
Printing Dashboard and Exporting Data
-
Export to CSV and Excel
-
Power BI Notifications
-
Alerts in the Power BI Service
-
Personal Gateway
-
Publishing to Web
-
Admin Portal
-
Introduction to Power BI Mobile
-
Scheduled Refresh
-
Row-level Security
-
Importing Excel Data Using Simple Table
-
Excel Workbook with Excel Data Model
-
Connecting to Excel Workbook on OneDrive for Business
-
Pinning Excel Tables or Visuals
-
Analysing Data in Excel
-
Direct Connectivity to SQL Azure
-
Direct Connectivity to SQL Database
-
Interactive API Console
-
Connecting a Web Page
-
Connecting with PDF
Enquire About Data Analytics Training in Coimbatore
Contact Refinement Software Solutions to enquire about the Data Analytics Course in Coimbatore, detailed syllabus, course fees, available batches and training options. Our team can help you understand the course structure and choose a learning path suited to your goals.
Why Choose Us?
Why choose Refinement Software Solutions as your IT training Institute?

Study from remote locations
Our online course aims to improve coding abilities through group projects led by teachers and other participants.

Reason based learning
Gain comprehensive of a subject by understanding its WHAT, WHY, and HOW aspects, simplifying the subject matter for in-depth comprehension.

Live & Interactive
Engage in discussions, ask questions, and seek clarifications from our certified instructors with extensive experience in the subject matter.

Mentored by industry experts
Experienced industry practitioners mentor with over ten years of experience. Provide timely reviews and feedback on assignments and projects.

Curriculum designed by experts
Our Course curriculum undergoes multiple levels of design and preparation by experts to ensure relevance to daily technological changes.

Blended learning model
Our learning methods offer the best classroom training and online learning. And our courses designed to meet individual needs and preferences.
FAQ
Data Analytics Course FAQs
Data Analytics is the process of collecting,
cleaning, transforming and analyzing data to
identify patterns, understand business performance
and support better decision-making.
The course covers Power BI Desktop, Power Query,
data transformation, data modelling, DAX,
interactive reports, dashboards and Power BI Service.
Excel and direct data connectivity topics are
also included in the syllabus.
You can begin learning Power BI without advanced
programming knowledge. The course introduces
data transformation, Power Query and DAX concepts
step by step. Basic computer skills and an interest
in working with data are helpful.
Students, graduates, working professionals and
people looking to develop data analysis skills
can consider this course. It is useful for those
interested in business reporting, dashboards
and data-driven decision-making.
Power BI is used to connect to data sources,
transform data, create data models and build
interactive reports and dashboards. It helps
users present business information visually.
DAX stands for Data Analysis Expressions.
It is a formula language used in Power BI
to create calculated columns, measures,
calculated tables and analytical calculations.
The course includes DAX syntax, filter context
and common functions.
Yes. The syllabus includes Power Query topics
such as filtering, sorting, removing errors,
replacing values, merging and appending tables,
pivoting and unpivoting data, creating custom
columns and working with multiple data sources.
Yes. The syllabus covers charts, maps, tables,
matrices, slicers, cards, KPIs, filters,
drillthrough, bookmarks, report interactions
and dashboard features in Power BI Service.
Yes. The syllabus includes importing Excel data,
connecting to SQL databases and SQL Azure,
connecting to web pages and PDFs, and working
with different data connectors.
Relevant career paths may include Data Analyst,
Power BI Developer, Reporting Analyst,
Business Intelligence Analyst and MIS Analyst.
Actual opportunities depend on your skills,
experience and employer requirements.
Yes. The syllabus includes publishing reports,
creating dashboards, sharing content, configuring
scheduled refresh, working with alerts and
understanding row-level security in Power BI Service.
Level up, step in, and start your career journey
with Refinement Software Solutions